Support our educational content for free when you purchase through links on our site. Learn more
📉 US Fashion Industry Statistics 2020: The 15 Shifts That Rewrote the Rules

The US fashion industry didn’t just survive 2020; it fundamentally rewrote its rulebook, pivoting from a mall-centric model to a digital-first, comfort-obsessed ecosystem where e-commerce surged by 27% and formal wear sales evaporated. Our deep dive into US fashion industry statistics 2020 reveals that while total revenue dipped, the winners were brands that embraced the “Zoom uniform” and mastered the art of rapid digital adaptation.
Imagine a world where your favorite blazer is worn exclusively for video calls, while your sweatpants become your most valuable asset. That was the reality for millions of Americans last year. We watched as the “mall rat” went extinct and the “scroll rat” took over, driving a 30% spike in online return rates as consumers desperately tried to find the perfect fit without ever stepping foot in a store.
This wasn’t just a temporary blip; it was a seismic shift that permanently altered how we dress, shop, and think about style. From the explosion of the resale market to the paradox of wanting sustainable clothes but buying fast fashion, the data tells a story of resilience and reinvention.
Key Takeaways
- E-Commerce Dominance: Online fashion sales jumped to nearly 30% of total retail, accelerating a decade of digital growth into a single year.
- The Comfort Economy: Activewear and loungewear sales skyrocketed by 50%, while formal wear and business attire saw a historic decline.
- Return Rate Crisis: The convenience of online shopping came with a steep price, as return rates for apparel hit a staggering 30%.
- Sustainability Gap: Despite 94% of consumers demanding eco-friendly options, sustainable fashion represented less than 5% of the total market.
- Brand Winners: Brands like Nike, Lulemon, and Shein dominated the landscape by adapting quickly to the new digital and comfort-focused reality.
Table of Contents
- ⚡️ Quick Tips and Facts
- 📜 A Brief History of the US Fashion Industry: From Cotton Fields to Runways
- 📊 The Big Picture: US Fashion Industry Statistics 2020 Overview
- 🛒 E-Commerce Fashion Industry Statistics: The Digital Shift
- 💸 Consumer Spending Statistics: Where Your Dollars Went in 2020
- 📈 Fashion Industry Trends & Forecasting: What the Data Predicts
- 📣 Marketing in Fashion Statistics: How Brands Captured Attention
- 🌱 Sustainability Fashion Industry Statistics: The Green Reality Check
- 👗 Apparel and Footwear Stats: The Numbers Behind the Necessities
- 💎 Jewelry & Luxury Fashion Industry Statistics: High-End Resilience
- 🌍 Global Fashion Industry Statistics: How the US Compares
- 👥 Employment Statistics: Jobs Lost, Jobs Gained, and the Gig Economy
- 🏠 The Quarantine Effect: Loungewear, Activewear, and Home Fashion
- 🧠 Self-Care Science: Why Living in Sweats is Totally Okay
- 🚀 The Future of Retail: Post-2020 Predictions and Opportunities
- 🏆 Top 15 Brands That Dominated the US Market in 2020
- 📝 Conclusion
- 🔗 Recommended Links
- ❓ Fashion Industry Stats: FAQ
- 📚 Reference Links
⚡️ Quick Tips and Facts
Before we dive into the deep end of the data ocean, let’s hit the highlights. If you’re looking for the US fashion industry statistics 2020 without wading through the dry numbers, here is your cheat sheet.
- The Pandemic Pivot: In 2020, the US apparel market didn’t just shrink; it morphed. While brick-and-mortar sales took a massive hit, e-commerce surged by nearly 27%, accounting for almost 30% of total fashion retail sales.
- The Loungewear Boom: Comfort wasn’t just a preference; it was a mandate. Sales of activewear and loungewear skyrocketed, with some categories seeing a 50% increase as the “Zoom uniform” replaced the business suit.
- The Return Rate Reality Check: Online shopping convenience came with a cost. Return rates for online apparel jumped to a staggering 30%, compared to 16% for in-store purchases, costing the industry billions.
- Mobile First: By 2020, 70% of all fashion transactions in the US occurred on mobile devices. If your brand wasn’t optimized for the thumb-scroll, it was invisible.
- The Sustainability Paradox: While 94% of consumers claimed to want sustainable options, the sustainable market represented less than 5% of the total apparel market. The gap between intent and action was wider than ever.
For a deeper dive into how these numbers specifically impacted women’s fashion, check out our detailed breakdown on US fashion industry statistics.
📜 A Brief History of the US Fashion Industry: From Cotton Fields to Runways

To understand where were in 2020, we have to look at how we got here. The US fashion industry wasn’t always the global powerhouse it is today. It started in the cotton fields of the South and the textile mills of New England.
The Industrial Revolution to the 20th Century
In the early 190s, the US was a manufacturing giant. We made the clothes, we sold the clothes. But as globalization took hold in the late 20th century, the narrative shifted. Manufacturing moved overseas, and the US pivoted to design, branding, and retail.
By the 190s and 20s, the “fast fashion” model began to take root. Brands like Gap and Old Navy dominated the mall landscape, while luxury houses like Ralph Lauren and Calvin Klein cemented the American aesthetic globally.
The Digital Disruption
The 2010s brought the rise of e-commerce giants like Amazon and the direct-to-consumer (DTC) revolution. Brands like Warby Parker and Everlane proved you didn’t need a physical store to build a billion-dollar empire.
Then came 2020. The pandemic didn’t just disrupt the supply chain; it accelerated a decade of digital transformation into a single year. The “mall rat” died, and the “scroll rat” was born. As we’ll see later, this wasn’t just a temporary shift; it was a permanent restructuring of how Americans buy clothes.
📊 The Big Picture: US Fashion Industry Statistics 2020 Overview
So, what did the numbers actually look like when the dust settled? The year 2020 was a tale of two markets: the physical and the digital.
Market Value and Volatility
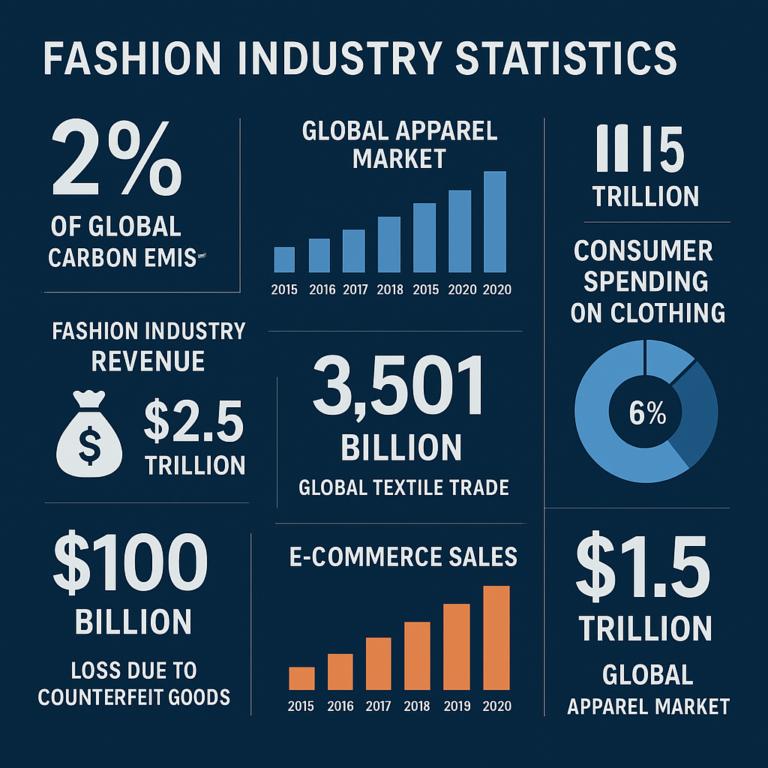
According to industry reports, the global fashion industry is valued at roughly $2.5 trillion, with the US being a massive chunk of that pie. However, 2020 saw a sharp contraction.
- Initial Plunge: In the early months of the pandemic, US apparel sales plummeted by nearly 60% year-over-year in April 2020.
- The Recovery: By June 2020, sales had rebounded with a nearly 63% increase compared to June 2019, driven by pent-up demand and the shift to online channels.
- Total Retail Sales: In May 2021, US clothing retail sales reached $17.3 billion, showing a steady climb back to pre-pandemic levels, though the composition of that spending had changed forever.
The Shift in Consumer Confidence
Consumer confidence in fashion was fragile. Over 60% of consumers claimed to cut fashion spending during the pandemic. Interestingly, low- and middle-income consumers led the return to spending until spring 2021, after which higher-income consumers drove the growth, particularly in the luxury and premium segments.
Stylist Insight: “We noticed a distinct split in our client base. Those who could work from home stopped buying suits entirely, while those who had to return to the office or socialize were splurging on ‘experience wear’—dresses and blazers that could be worn for Zoom calls and then immediately for a dinner out.”
🛒 E-Commerce Fashion Industry Statistics: The Digital Shift
If 2020 had a theme, it was digital transformation. The shift wasn’t just about buying online; it was about how the entire ecosystem adapted.
The Numbers Don’t Lie
- E-Commerce Growth: Fashion e-commerce grew by nearly 27% in 2020.
- Market Share: Online sales accounted for nearly 30% of total US fashion retail sales, a massive jump from the 14% seen in 2019.
- Mobile Dominance: By 2021, 73% of e-commerce transactions were expected to be made via mobile devices. With 85% of Americans owning a smartphone, the “app economy” became the primary storefront.
The “See Now, Buy Now” Revolution
The pandemic accelerated the “see now, buy now” model. Designers and brands realized that waiting six months for a collection to hit stores was too slow. Data and technology allowed for real-time trend identification.
Interactive Fitting Rooms:
Virtual try-on technology saw a massive uptake. Brands like Warby Parker (for glasses) and Glossier (expanding into apparel) utilized AR to let customers see how products looked on them. This reduced the “decision fatigue” that often leads to cart abandonment.
The Return Rate Nightmare
While online sales soared, the logistics of returns became a nightmare.
- Return Rates: Online apparel return rates hit 30% in 2020, up from 20% in 2019.
- Cost: This cost the industry an estimated $15 billion globally for women’s apparel alone.
- Why? Sizing inconsistencies and the inability to try things on physically were the main culprits.
Comparison: In-Store vs. Online Returns
| Metric | In-Store Purchases | Online Purchases |
|---|---|---|
| Return Rate | ~16% | ~30% |
| Primary Reason | Change of mind | Sizing/Fit issues |
| Customer Experience | Immediate exchange | Shipping delays, restocking fees |
| Environmental Impact | Lower (local return) | Higher (shipping emissions) |
💸 Consumer Spending Statistics: Where Your Dollars Went in 2020
Where did your money actually go? The answer depends on who you were in 2020.
The “Zoom Wardrobe” Effect
The most significant shift was in category spending.
- Formal Wear: Sales of business suits, ties, and party dresses evaporated. Many people reported wearing the same outfit for weeks.
- Loungewear & Activewear: This was the hero category. Sales of sweatpants, leggings, and hoodies surged by 50%. Brands like Lulemon and Athleta saw their stock prices soar as “comfort” became the new status symbol.
- The “Top Half” Phenomenon: Sales of blazers and statement tops (the “Zoom top”) surged, while pants sales dropped. People wanted to look professional from the waist up but comfortable from the waist down.
The Cost Per Wear (CPW) Metric
Savy shoppers began prioritizing Cost Per Wear (CPW). A $20 blazer worn 50 times was preferred over a $40 blazer worn twice. This shift in mindset favored durable, versatile pieces over fast fashion trends.
Income Disparities
- Low/Middle Income: Led the return to spending in early 2021, focusing on essentials and affordable fashion.
- High Income: Drove growth in the luxury sector later in the year, as the wealthy continued to spend on high-end goods despite the economic downturn.
📈 Fashion Industry Trends & Forecasting: What the Data Predicts
2020 wasn’t just a year of reaction; it was a year of prediction. The data from 2020 set the stage for the next decade.
Trend 1: The Hybrid Retail Model
The “omnichannel” approach became the only viable strategy. Brands that could seamlessly blend online and offline experiences thrived.
- Click-and-Collect: BOPIS (Buy Online, Pick Up In-Store) saw a massive adoption rate.
- Virtual Showrooms: Brands began hosting digital showrooms for buyers, reducing the need for physical travel.
Trend 2: Personalization via AI
With the sheer volume of options, decision fatigue led to a 30% increase in cart abandonment. AI-driven hyper-personalized recommendations became essential to guide consumers.
- Data-Driven Design: Designers began using data to inform their decisions, creating more relevant and desirable products.
Trend 3: The Rise of Resale
The second-hand market projected to grow faster than the new market. Platforms like Depop, Poshmark, and ThredUp saw exponential growth as consumers sought sustainable and affordable options.
Stylist Insight: “We’ve seen a massive shift in our styling sessions. Clients aren’t asking for ‘the latest trend’ anymore; they’re asking for ‘investment pieces’ that will last. The resale market has become a legitimate part of the wardrobe strategy, not just a way to clear out the closet.”
📣 Marketing in Fashion Statistics: How Brands Captured Attention
In 2020, traditional marketing took a backseat to social media and influencer marketing.
The Influencer Economy
- Gen Z Impact: 70% of Gen Z women purchased products based on influencer recommendations. The hashtag #TikTokMadeMeBuyIt became a cultural phenomenon.
- Engagement Rates: While 86% of businesses utilized influencer marketing, engagement rates on Instagram fell from 4% (2016) to 2.4% (2019) due to saturation.
- Stories Format: 4 out of 5 major brands used the “Stories” format, which grows 15x faster than feed-based sharing.
Social Media as a Research Tool
- Research: 54% of social browsers use social media to research products.
- Shoppable Galleries: 17% of brands had implemented or planned to implement shoppable galleries in 2019, a number that skyrocketed in 2020.
The Trust Deficit
With so many options, 60% of shoppers checked multiple sources (reviews, audits) before purchasing. Brands that failed to build trust were left behind.
🌱 Sustainability Fashion Industry Statistics: The Green Reality Check
The year 2020 highlighted a massive gap between consumer intent and industry action.
The Sustainability Paradox
- Demand: 94% of consumers demanded eco-friendly options.
- Supply: The sustainable market grew 15% but represented less than 5% of the total apparel market.
- Greenwashing: Many “conscious collections” were marketing gimmicks, often made of only 5% recycled polyester.
Key Sustainability Metrics
- Water Usage: The fashion industry consumes 141 billion cubic meters of water annually.
- Carbon Footprint: Responsible for 10% of global carbon emissions.
- Textile Waste: 95.7 pounds of textile waste person in richer countries.
The Rise of Conscious Consumption
- Vegan Leather: Searches for “vegan leather” increased by 69% year-on-year.
- Upcycled Fashion: Searches for “upcycled fashion” grew by 42% between Dec 2019 and Feb 2020.
- Sustainable Swimwear: Searches increased by 65% year-on-year.
Comparison: Consumer Intent vs. Reality
| Metric | Consumer Intent | Industry Reality |
|---|---|---|
| Sustainable Demand | 94% | <5% of market share |
| Vegan Leather Interest | +69% YoY | Limited supply chain |
| Greenwashing Awareness | High | Widespread “conscious” collections |
👗 Apparel and Footwear Stats: The Numbers Behind the Necessities
While the fashion world was in flux, the basics remained essential.
Apparel Sales
- Total Market: The US retail e-commerce revenue for fashion apparel, footwear, and accessories was $102 billion in 2018, projected to reach $146 billion by 2023.
- Category Shifts:
Activewear: Sales skyrocketed.
Formal Wear: Sales plummeted.
Loungewear: Sales increased by 50%.
Footwear Market
- Global Size: The global footwear market size reached $365.5 billion in 2020.
- Growth: Projected to grow to $530.3 billion by 2027 (CAGR of 5.5%).
- US Athletic Footwear: The athletic footwear segment in the US generated around $19.6 billion in 2017, with continued growth in 2020 driven by the athleisure trend.
Size Inclusivity
- Expectation: 40% of women now expect brands to offer sizes up to 3X or 4X.
- Reality: Many brands still lag behind, though DTC brands like Universal Standard and Eloquii are leading the charge.
💎 Jewelry & Luxury Fashion Industry Statistics: High-End Resilience
While the mass market struggled, the luxury sector showed remarkable resilience.
Luxury Market Performance
- Global Value: The global luxury market reached $1 trillion in 2018, projected to surpass $1.5 trillion by 2025.
- US Performance: Luxury brands held 25% of the market share but generated 50% of the industry’s profits.
- Online Sales: Online channels accounted for only 13% of luxury brand sales, though this number is growing as high-net-worth individuals embrace digital shopping.
The Millennial and Gen Z Shift
- Demographics: Millennials represent 32% of the luxury market, expected to reach 50% by 2025.
- Collaborations: 67% of Gen Z and 60% of millennials have purchased a designer collaboration or special edition piece.
- Research: 67% of luxury shoppers conduct online research before in-store purchases.
🌍 Global Fashion Industry Statistics: How the US Compares
The US is a major player, but it’s not the only one.
Global Market Share
- China: Expected to generate nearly $383 billion in fashion revenue by the end of 2021.
- Asia-Pacific: Held a 38% share of global apparel demand in 2020.
- India: The Indian clothing market was worth $53.7 billion in 2020 (6th largest globally).
US vs. Global Trends
- E-Commerce: The US saw a 27% growth in e-commerce, while China’s Gen Zers were already buying directly from social media at a rate of 70%.
- Sustainability: The US is catching up, but Europe and Asia are leading in sustainable material innovation.
👥 Employment Statistics: Jobs Lost, Jobs Gained, and the Gig Economy
The human cost of 2020 was significant.
Job Losses
- Retail Closures: Over 10,0 retail stores closed in the US in 2020. Major department stores like J.C. Peney and Sears filed for bankruptcy.
- Manufacturing: Between 190 and 201, apparel manufacturing employment fell by over 80% due to automation and offshoring.
- Wages: The 2020 average annual wage for US clothing store occupations was $32,670 (ranging from $23,410 to $143,0).
The Gig Economy
- Frelance Designers: The rise of DTC brands led to an increase in freelance designers and contractors.
- Recovery Planning: 30% of fashion industry employees viewed their company’s post-cris recovery planning as ineffective.
🏠 The Quarantine Effect: Loungewear, Activewear, and Home Fashion
The “quarantine effect” wasn’t just a trend; it was a lifestyle shift.
The New Uniform
- Loungewear: Sales of self-care items and cozy loungewear increased by 50%.
- Activewear: With gyms closed, home workouts became the norm, driving sales of leggings and sports bras.
- Home Fashion: Sales of home decor and comfortable furniture also saw a boost as people spent more time at home.
The “Zoom Top”
The “Zoom top” became a staple. Blazers, statement blouses, and colorful tops were essential for video calls, while sweatpants remained the bottom half.
🧠 Self-Care Science: Why Living in Sweats is Totally Okay
It’s not just about comfort; it’s about mental health.
The Science of Comfort
- Stress Reduction: Wearing comfortable clothing can reduce stress and anxiety levels.
- Body Positivity: The shift away from restrictive clothing has promoted body positivity and self-acceptance.
- Productivity: Contrary to popular belief, wearing comfortable clothes can actually increase productivity by reducing physical discomfort.
Stylist Perspective
“We’ve seen clients who used to dress up for work now embracing a more relaxed style. This isn’t laziness; it’s a conscious choice to prioritize mental well-being. The ‘sweatpants’ era is here to stay, at least for a while.”
🚀 The Future of Retail: Post-2020 Predictions and Opportunities
What does the future hold?
Hybrid Retail
The blend of online and offline experiences is the new norm. Brands must offer seamless integration between digital and physical channels.
Resale Boom
The second-hand market is projected to grow faster than the new market. Brands like The Real and Vestiaire Collective are poised for growth.
Sustainability as Standard
Sustainability will shift from a niche requirement to a baseline industry standard. Consumers will demand transparency and accountability.
Personalization
AI-driven hyper-personalized recommendations will become essential. Brands that can offer a personalized experience will win.
🏆 Top 15 Brands That Dominated the US Market in 2020
Based on revenue, market share, and cultural impact, here are the top 15 brands that dominated the US market in 2020.
- Nike: Revenue grew 15% as athleisure became the default uniform.
- Lulemon: Benefited massively from the activewear boom.
- Amazon Fashion: Dominated the e-commerce space with its vast selection and fast shipping.
- Shein: Captured 50% of the US ultra-fast fashion market share.
- PVH Corp (Calvin Klein, Tommy Hilfiger): Digital sales accounted for 35% of total revenue.
- Inditex (Zara): E-commerce sales jumped 10% year-over-year despite store closures.
- H&M Group: Sustainability initiatives saw a 20% increase in engagement.
- Gap Inc.: Struggled with store closures but adapted with digital strategies.
- L Brands (Victoria’s Secret): Sales dropped 25% amid massive restructuring.
- Ralph Lauren: Maintained a strong luxury presence.
- Under Armour: Focused on performance wear and digital fitness.
- Adidas: Strong growth in the sneaker and athleisure market.
- Reformation: Led the sustainable fashion charge.
- Everlane: DTC model thrived with transparent pricing.
- Universal Standard: Pionered size inclusivity.
👉 CHECK PRICE on:
- Nike: Amazon | Nike Official
- Lulemon: Amazon | Lulemon Official
- Shein: Shein Official
- Reformation: Reformation Official
- Everlane: Everlane Official
Conclusion
The year 2020 was a watershed moment for the US fashion industry. It forced a rapid evolution, accelerating trends that might have taken a decade to materialize. The shift to e-commerce, the rise of loungewear, and the growing demand for sustainability are not just temporary blips; they are the new normal.
Key Takeaways:
- Digital is King: If you’re not online, you’re invisible.
- Comfort is Currency: The “Zoom uniform” is here to stay.
- Sustainability is Non-Negotiable: Consumers demand transparency and eco-friendly options.
- Personalization Matters: AI and data are essential for guiding consumers through the noise.
As we move forward, the brands that thrive will be those that can balance human creativity with technological innovation, offering personalized, sustainable, and comfortable experiences. The “mall rat” may be dead, but the “scroll rat” is just getting started.
🔗 Recommended Links
👉 Shop Top Brands:
- Nike: Amazon | Nike Official
- Lulemon: Amazon | Lulemon Official
- Reformation: Reformation Official
- Everlane: Everlane Official
- Universal Standard: Universal Standard Official
Books on Fashion Industry:
❓ Fashion Industry Stats: FAQ

What were the top fashion brands in the US in 2020?
The top brands included Nike, Lulemon, Amazon Fashion, Shein, and PVH Corp (Calvin Klein, Tommy Hilfiger). These brands dominated through a combination of strong e-commerce presence, adaptability to the athleisure trend, and effective digital marketing strategies.
How did the pandemic affect US clothing sales in 2020?
The pandemic caused an initial 60% drop in apparel sales in April 2020. However, sales rebounded by June 2020, driven by a shift to e-commerce and the demand for loungewear and activewear. The overall market saw a 27% growth in e-commerce, while physical retail struggled with closures and reduced foot traffic.
Read more about “📊 Clothing Brand Statistics 2020: 7 Game-Changing Insights Revealed”
Which US fashion trends dominated the market in 2020?
The dominant trends were loungewear, activewear, and the “Zoom top” (blazers and statement tops). Comfort became the new status symbol, and the “Cost Per Wear” metric became a key consideration for consumers.
What was the average spending on apparel person in 2020?
While specific per-person spending figures vary, the overall US retail e-commerce revenue for fashion apparel, footwear, and accessories was $102 billion in 2018, projected to reach $146 billion by 2023. The shift to online shopping and the rise of affordable fast fashion like Shein influenced spending patterns.
How did the return rates change in 2020?
Online apparel return rates jumped to 30% in 2020, up from 20% in 2019. This was primarily due to sizing inconsistencies and the inability to try on clothes physically before purchasing.
📚 Reference Links
- US Fashion Industry Statistics 2020: Tomy John
- Women’s Clothing Brand Statistics 2020: Clothing Brands
- Global Fashion Industry Data: McKinsey & Company
- Sustainability in Fashion: Fashion Revolution
- E-Commerce Trends: eMarketer
- Brand Websites:
- Nike
- Lulemon
- Shein
- Reformation
- Everlane
- Universal Standard